It’s time to make your data actionable. Since 2010, SC Labs’ chemometric classification research has supported and validated the reporting algorithm.
Advanced visualization reports are updated in real-time and display a complete chemical profile of cannabis or hemp products. Take a closer look at our report below.
Have a look for yourself
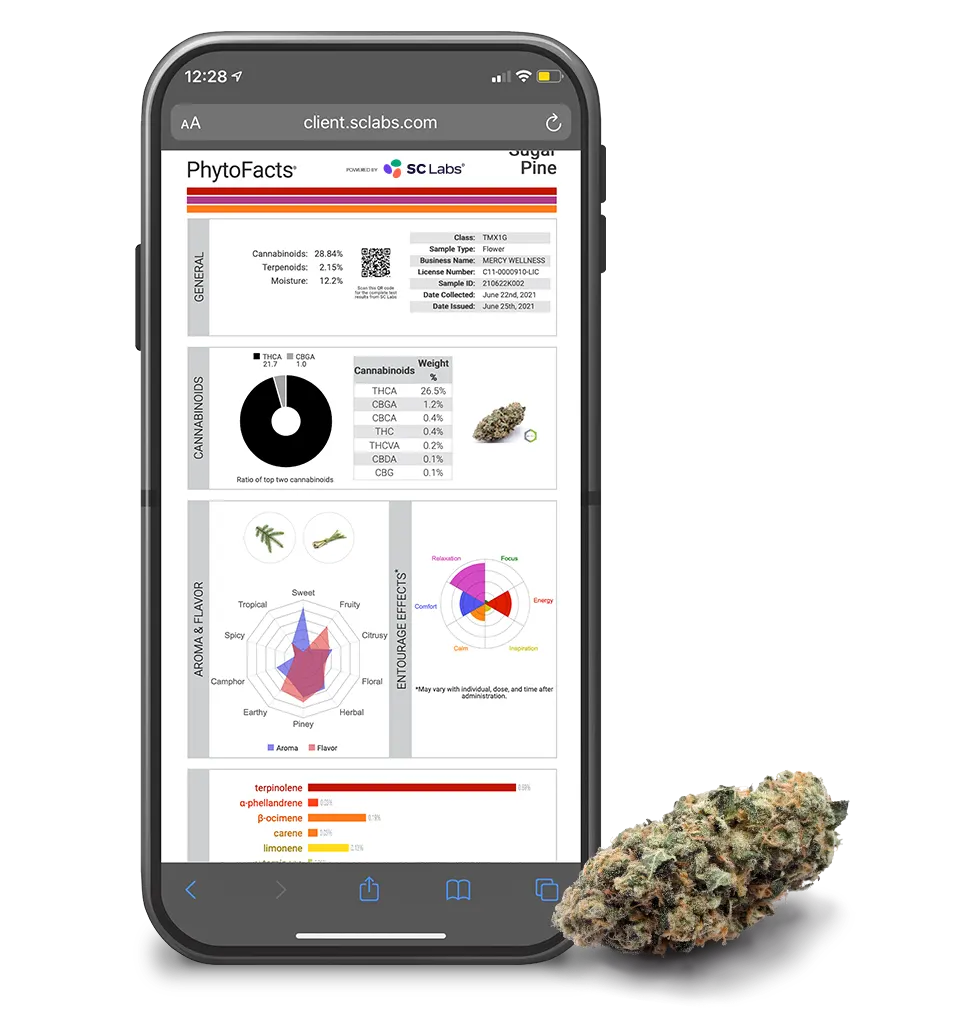
For flower and concentrates, the report provides business buyers and consumers a consistent and easy way to evaluate the product prior to purchasing or consuming.
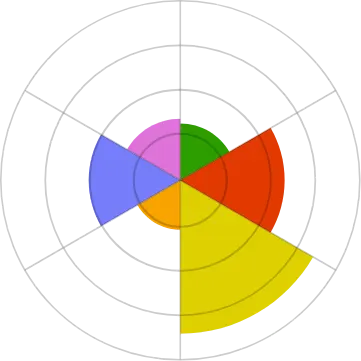
The suggested entourage effects are displayed on a polar area chart with six categories: Relaxation, Focus, Energy, Inspiration, Calm, and Comfort. What do these mean?
Learn more about terpene testing and Chemometric Reporting
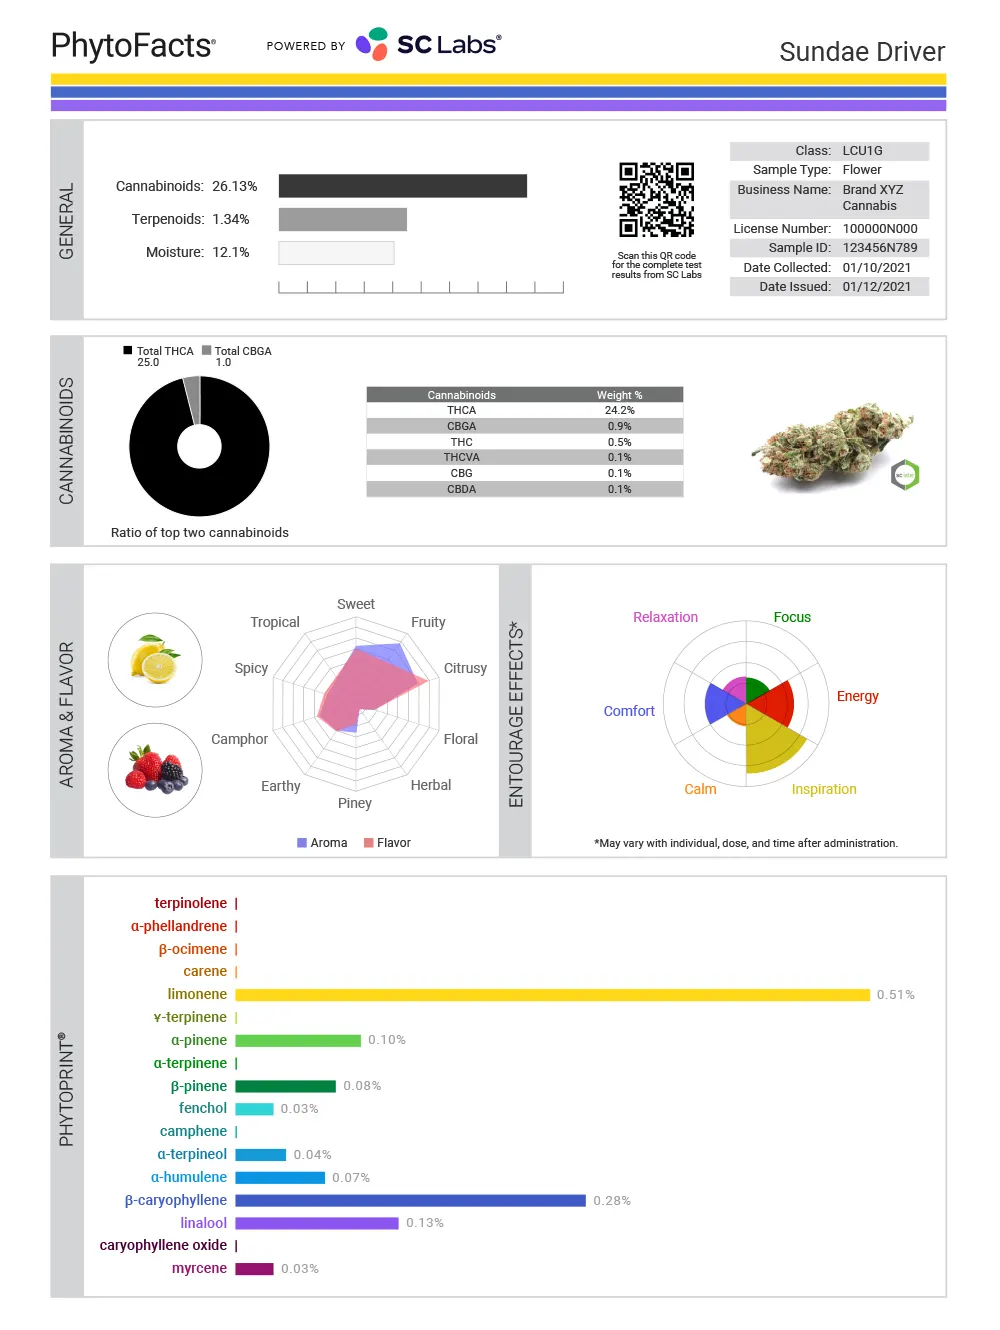
These color bars depict the top three terpenes in order of weight percent. Designed for terpene recognition. Can be used to group “similar” cultivars.
This is the sample name/cultivar as entered by the client.
This chart shows total cannabinoid, terpenoid, and moisture content. Offering a ratio indicator, scales fixed at 30% cannabinoids, 3% terpenes, and 20% moisture.
A QR code takes you this sample’s full lab results.
Test details for sample type, business name, license, sample ID, date collected, and date issued, as found in the certificate of analysis.
Class is five-character code given to the sample provides insight into terpene and cannabinoid makeup. The first three letters denote the most relevant terpenes in order. The next digit signifies the Chemotype (I, II, III, etc) which implies dominant cannabinoid. The final letter represents the second most dominant cannabinoid.
The dial shows the ratio of the top two cannabinoids. Easily identify Type I, II, and III cultivars. Dominant cannabinoid drives pharmacology, runner-up modulates it.
The top 6 cannabinoids found in the sample are represented in the table with a minimum value of 0.05%.
This is an image of the sample before undergoing analysis.
This organoleptic data helps identify aroma and flavor attributes. The top two traits are represented as pictures, while the lines in the radar chart are proportional to intensity.
An algorithm converts terpenoid and cannabinoid data into suggested effects based synergistic action within the endocannabinoid system.
While SC Labs quantifies 39 terpenoids, the PhytoFacts presents the 17 most commonly occurring. Bar color and length allow rapid identification of possible patterns between similar or dissimilar strains.
Entourage Effect Descriptions
Effects can vary depending on the product, the individual, and the time after administration. The strength of the anticipated effect is indicated by the number of concentric circles in the chart.
Relaxation
A relaxing terpene influence on cannabinoid pharmacology that is often represented by decreased energy levels and diminished mental acuity, and can also be perceived as physical heaviness.
Comfort
A comforting terpene influence on cannabinoid pharmacology that is often represented by a perceived state of physical ease and a sense of freedom from constraint.
Calm
A calming terpene influence on cannabinoid pharmacology that is often represented by feelings of serenity, contentment, restfulness, and complacency.
Focus
A focusing terpene influence on cannabinoid pharmacology that is often represented by enhanced crispness in perception and an elevated ability to filter thought activity.
Energy
An energizing terpene influence on cannabinoid pharmacology that is often represented by increased rates of thought, elevated alertness, and wakefulness.
Inspiration
An inspiring terpene influence on cannabinoid pharmacology that is often represented by enhanced creativity, an increase in mental acuity, and reduction of mental burdens.